MONITORING ECONOMIC CRISIS - XIII
(Week I, December 2007) BEAR MARKET RALLY - RALLY oversold Topics This time REVIEW STOCK MARKET - RALLY oversold CHARACTERISTICS BEAR MARKET GOLD, SILVER AND MATERIAL COMMODITIES REFLECTION
STOCK MARKET REVIEW - oversold RALLY
In the last week I've been warned to be on market conditions have been extremely oversold, especially the sector financially. " There is a possibility the market will Rebounce for the sales of national (Black Friday) in the US on Friday November 23 2007 after Thanks Giving Day, seems crowded enlivened by buyers storming stores . " " I'll use the time now until the end of the year to throw a short position because the market is already quite bearish (see Chart 1, in this article) and start collecting stocks of gold that will probably end the correction period Nutshell. Investors are bullish already approaching the level in August 2007. It is better braced contrarian stance . "

Chart 1 Bull Position Percentage S & P 500 last week

Chart 2 Rally like this is very emotional and is not supported by a sane mind at all. For example on Tuesday, November 27, 2007, the Dow industrial average rose more than 300 points. On the day that Citigroup rose 6.5% despite the previous day there was news that Citigroup would cut jobs as many as 45000 people. Number 45000 people was great. In other words, Citigroup will shrink operations.

chart 3
chart 4
Whenever the market freefall, volatility rose and the stock index reached the final level before reversalnya always lower than the previous low point-ter (lower low). And when the rebound, peak (the highest level) index stock price is always lower than the previous peak. The market can be said to be overbought when the RSI (14 wk) reached a level slightly above 50. The frequency of RSI (14wk) are under level 50. To determine oversold, RSI (14 wk) at a level lower than 40. Figures such as RSI (14 wk) lower than 40, to oversold; RSI (14 wk) higher than 53 for overbought, and so should be seen as an empirical figures. These figures could be changed for a different bear market. At least, this study can help us to set up a trading strategy. Determine when, when to decrease or increase the short position; and also when to reduce / increase long positions. During the years 2000- 2003 bear market, I was relatively successful trading. The next question: " What the Fed can affect the market ?" He replied: " No ".
We see Chart below. Stock markets began to show symptoms bearish in early 2000. The Fed began cutting interest rates in January 2001. During the year the interest rate the Fed trimmed aggressive from 6.5% to 1.75% in December 2001.

chart 5
When viewed as aggressive although during 2001 the Fed cut rates to 1.75%, then continued until becoming 1% in 2003, the stock market remains bearish. The decline in interest rates the Fed did not help. By looking at the history of seven years ago, perhaps we can understand where the myth (a rate cut by the Fed could reverse of the bear market to a bull market) and what is reality. It can thus be planned better strategy. There is a saying: "Bulls make money, Bears make money, Pigs get Slaughtered." This means that in the period of a bear market or a bull market (what else bear market), should not be too long to hold long or short positions ,Should know when from out of position. If not, his fate like a pig in a slaughterhouse. Every person who jumped into the stock market should understand the risks it will face if he is not ready. That bear losses, GOLD, SILVER AND RESOURCE COMMODITY seems that Silver and gold is not in line with the stock market. Last week, when the stock market rally, gold and silver experienced a correction (Chart-6 to Chart 8). And at the end of last week gold and silver hit sector support. So have a chance to rebound. Expected to rebound this time is a continuation of the rally that took place since July 2007. Gold can be bolted to the level of $ 1000 / oz. Chart 6


chart 7

chart 8

chart 9
STOCK MARKET REVIEW - oversold RALLY
In the last week I've been warned to be on market conditions have been extremely oversold, especially the sector financially. " There is a possibility the market will Rebounce for the sales of national (Black Friday) in the US on Friday November 23 2007 after Thanks Giving Day, seems crowded enlivened by buyers storming stores . " " I'll use the time now until the end of the year to throw a short position because the market is already quite bearish (see Chart 1, in this article) and start collecting stocks of gold that will probably end the correction period Nutshell. Investors are bullish already approaching the level in August 2007. It is better braced contrarian stance . "

Chart 1 Bull Position Percentage S & P 500 last week
When I saw the reverse flow, occurs Rebounce and posting in the Forum KlubSaham.Com, there is a colleague asked: "Why he said a recession?",
The US is already / before the recession. Said already and ahead, depends what way you measure it. What we see today (about the market Rebounce) is oversold rally or a bear market rally. The explanation is as follows: In the last week the index bull's percentage shares of the S & P reached the level of 36% (Chart-1 from last week's article). More extreme for the financial sector (Chart 2). Level achieved was 16%. These extreme levels usually unstable. Pressure / stress in the market is already too strong. Almost all the players bear market. Bull is already at the minimum level. So the chances of market participants who crossed from the bull camp to bear camp has been very small. As a result, the tendency is potential crossings of the bear camp is higher than the crossings into the bear camp. Potentially reduce the number of bear and bull amount could potentially grow to more. Little change (increase) bull percentage index, will make stock prices soared. The market will take the fight back to reduce stress. And it came to pass Rebounce.
The US is already / before the recession. Said already and ahead, depends what way you measure it. What we see today (about the market Rebounce) is oversold rally or a bear market rally. The explanation is as follows: In the last week the index bull's percentage shares of the S & P reached the level of 36% (Chart-1 from last week's article). More extreme for the financial sector (Chart 2). Level achieved was 16%. These extreme levels usually unstable. Pressure / stress in the market is already too strong. Almost all the players bear market. Bull is already at the minimum level. So the chances of market participants who crossed from the bull camp to bear camp has been very small. As a result, the tendency is potential crossings of the bear camp is higher than the crossings into the bear camp. Potentially reduce the number of bear and bull amount could potentially grow to more. Little change (increase) bull percentage index, will make stock prices soared. The market will take the fight back to reduce stress. And it came to pass Rebounce.

Chart 2 Rally like this is very emotional and is not supported by a sane mind at all. For example on Tuesday, November 27, 2007, the Dow industrial average rose more than 300 points. On the day that Citigroup rose 6.5% despite the previous day there was news that Citigroup would cut jobs as many as 45000 people. Number 45000 people was great. In other words, Citigroup will shrink operations.
On that day, November 27, there is news that Citigroup will acquire $ 7.5 billion cash injection from Abu it must be remembered that the operation Citigroup will shrink. Whether this could be a justification rally. Not only that, almost all sectors have rallied that day. What relation to other sectors with Citigroup? Rally for sympathizing? Therefore, this kind of a rally called oversold rally. Nothing to do with market fundamentals. The rally will continue, possibly as bull percentage above 50% before declining market back on track. My target this time the Dow Industrial will encounter strong resistance at the level of 13600 - 13700. There is a 50 day MA, some of the peaks, and the 62% Fib retracement Bolliger top band at the level 13600 - 13700. Suppose this level can be achieved, I will throw position long and short positions back into stocks for the retail, financial and real estate. Mechanistically, the continuation of this rally until it reaches the level of 13600-13700 supported the positive sentiment of the Fed rate cut on December 11 to come. In my opinion, the Fed's rate cut will not affect the main trend of the period bear today.

chart 3
Fundamentally, the market will continue bearish, until these bad credit problems get solutions and bold investor lending. Today many debt that has accumulated in the bank can not be sold to investors due to low investor confidence in the bank. Consequently solvency of banks fell.Help liquidity by the central bank did not help. Look at the case BLBI in Indonesia. Japan is already 17 years still had not moved from its banking crisis. US should let the banks and financial institutions went bankrupt as a punishment for sin made by himself, which is a sin to pass credit to customers who can not afford to pay. CHARACTERISTICS OF THE BEAR MARKET To face a battle in the bear market, we must know the terrain. Although every bear market has its own characteristics, they have also similarities. Therefore it helps us learn the case of a bear market period. If we examine the bear market years of 2000 - 2003, the main trend and there is no up and down dramatically (Chart 4). Chart-4 is a weekly chart stock index Dow Industrial Average. You could say there is six times the market free fall like a waterfall, and after arriving in bottomnya, without further ado, immediately followed by a rally.
chart 4
Whenever the market freefall, volatility rose and the stock index reached the final level before reversalnya always lower than the previous low point-ter (lower low). And when the rebound, peak (the highest level) index stock price is always lower than the previous peak. The market can be said to be overbought when the RSI (14 wk) reached a level slightly above 50. The frequency of RSI (14wk) are under level 50. To determine oversold, RSI (14 wk) at a level lower than 40. Figures such as RSI (14 wk) lower than 40, to oversold; RSI (14 wk) higher than 53 for overbought, and so should be seen as an empirical figures. These figures could be changed for a different bear market. At least, this study can help us to set up a trading strategy. Determine when, when to decrease or increase the short position; and also when to reduce / increase long positions. During the years 2000- 2003 bear market, I was relatively successful trading. The next question: " What the Fed can affect the market ?" He replied: " No ".
We see Chart below. Stock markets began to show symptoms bearish in early 2000. The Fed began cutting interest rates in January 2001. During the year the interest rate the Fed trimmed aggressive from 6.5% to 1.75% in December 2001.

chart 5
When viewed as aggressive although during 2001 the Fed cut rates to 1.75%, then continued until becoming 1% in 2003, the stock market remains bearish. The decline in interest rates the Fed did not help. By looking at the history of seven years ago, perhaps we can understand where the myth (a rate cut by the Fed could reverse of the bear market to a bull market) and what is reality. It can thus be planned better strategy. There is a saying: "Bulls make money, Bears make money, Pigs get Slaughtered." This means that in the period of a bear market or a bull market (what else bear market), should not be too long to hold long or short positions ,Should know when from out of position. If not, his fate like a pig in a slaughterhouse. Every person who jumped into the stock market should understand the risks it will face if he is not ready. That bear losses, GOLD, SILVER AND RESOURCE COMMODITY seems that Silver and gold is not in line with the stock market. Last week, when the stock market rally, gold and silver experienced a correction (Chart-6 to Chart 8). And at the end of last week gold and silver hit sector support. So have a chance to rebound. Expected to rebound this time is a continuation of the rally that took place since July 2007. Gold can be bolted to the level of $ 1000 / oz. Chart 6

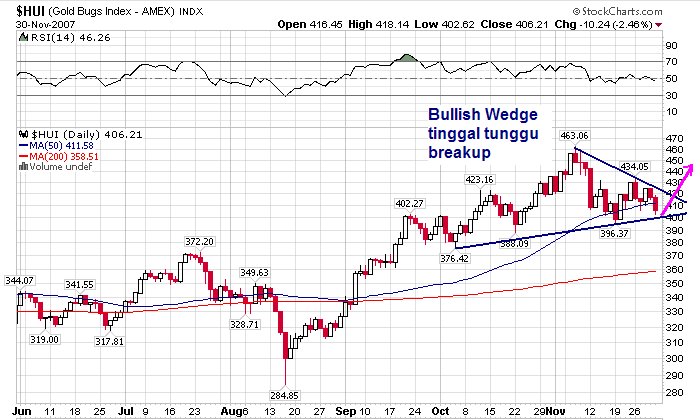
chart 7

chart 8
Mechanistically emotional, the Fed rate cut on December 11, 2007 that will come, it will trigger a gold rally back. I believe the Fed will cut rates again. At least 25 basis points. Maybe it could be, although I doubt this. The ECB is also likely to follow in the footsteps of the Fed, because the Euro is already so strong that European goods becoming uncompetitive, and also to help liquidity in Europe are affected by the credit crunch. Although I am not too sure that the chances of the ECB to cut rates large enough, I should faktorkan in seeing the situation in the next few months. What I'm less certain is the impact of the Fed rate cut. Whether to have a negative impact on the equity markets, or positive. Because the Fed's rate cut will make the US dollar weakened, including against the Japanese Yen. This will make the carry trader shriveled balls. Strengthening yen carry traders will make the debt go up in value. Therefore, I think the stock's technical analysis becomes an important barometer to determine the direction of the market. For the gold sector, I've been collecting Gammon Resources (GRS), Seabridge (SA), Metalline Mining (MMG). There are still some stocks of gold and silver and optionnya would call my collection next week. Especially for call option I think Barrick and Newmont with expiry date in June-July 2008 is good enough for their collection. In the commodity sector appears to have been no symptoms bearish. For copper, for example, the correction is characterized by a lower low and a lower high (Chart 8). Likewise, aluminum (Chart 9) show early symptoms of a bear market. In these circumstances, holding a long position for the long term is koyol. Can roast losses.

chart 9
Either copper or aluminum is a global economic indicators. Since both of these materials are widely used for the construction of infrastructure, buildings (houses / buildings), vehicles, and heavy equipment. If the economy slows, infrastructure development, construction or capital goods recedes, the demand for base metals like copper and aluminum also receded. So the conclusion that the world economic slowdown and toward recession, supported by the data base metal markets. We can put a short-term long positions on shares such as copper and Freeport (FCX). This is temporary, because dilatar-background by oversold Rebounce not fundamental. I am currently holding Aluminum Corp. of China (ACH), with the basic ideas Rebounce oversold stocks in China and Hong Kong. Consideration should be given to withdraw from the aluminum stock is if it is enough to make a profit.

chart 10
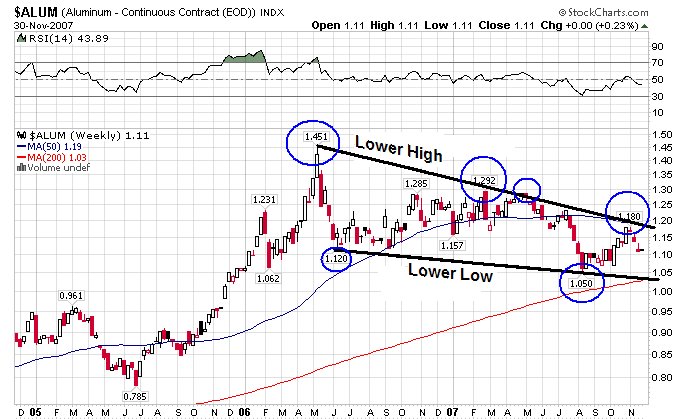
chart 10
Materials other commodities, namely oil, still do not show symptoms bearish for the main trend. However, it appears ready for a correction (Chart 11). I do not know whether the oil stocks will go correction or join other stocks being rally?


Chart-11
REFLECTION
Most likely in the next 2-5 years the stock market will be in a secular bear market periods.History proves that that the Fed and central banks can not reverse the secular bear market into a bull market with lower interest rates. People may believe. But the reality is not so. In the period bear market, investors have to be a trader. In that sense, know when to put up a long position and when to installer horses short. Opportunities to gain always there. Or if scared, he had to step aside just to be a spectator. Money deposited in savings. No profit or no risk of loss.Only the value of his savings down because central banks will print money could be ascertained if there is no tomorrow. Up here for this week. Take care of your health savings and your investments carefully.


Post a Comment