MONITORING ECONOMIC CRISIS - XIV
(Week II, December 2007) BEAR MARKET RALLY REACHES PEAK Topics This time: TO (NOT) policies STATE - US TO (NOT) policies STATE - INDONESIAREVIEW STOCK MARKET (CALM BEFORE THE STORM) Targetting DEAD CAT BOUNCE SECTOR OF GOLD AND SILVER DIRECTION BEHIND THE DOLLAR WILL?
REFLECTION
TO (NOT) policies STATE - US
Policy dibahasa Indonesiakan into wisdom. Usually that makes wisdom is that the government, often also " management companies ". Anyway dealing with for menbuat wisdom is that the position "above", but not God. Although it is often not at all wise discretion. Sometimes silly.Also strange is not it? That's politics. Bush made the wisdom to deal with the subprime crisis by creating new rules. The debtor will obtain credit waivers such as freezing the implementation of floating rate of interest teaser for 5 years. The eligible are as follows: 1. Borrowers owe the teaser rate period of 36 months or less 2. Mortgage loan signed between Jan. 1 2005 to 31 July 2007 and the change of teaser interest to floating interest between Jan. 1 2008 to 31 July 20103. The borrower is never overdue for more than 30 consecutive days or cumulative days in arrears of not more than 60 days 4. Debt Ratio: Home Values greater than 97% 5. FICO Score should be less than 660 and not increased by more than 10% during the credit has 6. Debtor judged unable to pay the mortgage is higher. Who wants to be helped by the (in) this wisdom? I think that is the creditors, owners of capital, bank, Goldman Sachs, Paulson Henk. Why is the finance minister Henk Paulson US? If we see points 3 and 6, show that the debtor is able to pay the loan on which interest is today. Then points 4 shows that if the debtor is "helped", it will benefit the bank or creditor. Most current asset value (homes) have gone down and the value is lower than the debt. Banks and lenders will be a big loss if it receives collateral whose value has been below the value of its debt. Perhaps it reminds you of the monetary crisis in Indonesia, where the collateral value has fallen below the value of the debt of the conglomerate when done menyerahan / foreclosure of collateral. Genesis in the US is now equal to the incidence of financial crisis in Indonesia. The role of the debtor in the US is currently held by the prospective owner of the house and in the future krismon Indonesia was once the debtor conglomerate. End of the subprime crisis in the US is unpredictable, which is similar to the end of the financial crisis in Indonesia. Many banks are broken, need assistance and currency liquiditi crashing. The first impact: the bank collapsed, the symptoms are already visible. The number of banks closed in 2007 began to appear, after two years of net (Table-1).
REFLECTION
TO (NOT) policies STATE - US
Policy dibahasa Indonesiakan into wisdom. Usually that makes wisdom is that the government, often also " management companies ". Anyway dealing with for menbuat wisdom is that the position "above", but not God. Although it is often not at all wise discretion. Sometimes silly.Also strange is not it? That's politics. Bush made the wisdom to deal with the subprime crisis by creating new rules. The debtor will obtain credit waivers such as freezing the implementation of floating rate of interest teaser for 5 years. The eligible are as follows: 1. Borrowers owe the teaser rate period of 36 months or less 2. Mortgage loan signed between Jan. 1 2005 to 31 July 2007 and the change of teaser interest to floating interest between Jan. 1 2008 to 31 July 20103. The borrower is never overdue for more than 30 consecutive days or cumulative days in arrears of not more than 60 days 4. Debt Ratio: Home Values greater than 97% 5. FICO Score should be less than 660 and not increased by more than 10% during the credit has 6. Debtor judged unable to pay the mortgage is higher. Who wants to be helped by the (in) this wisdom? I think that is the creditors, owners of capital, bank, Goldman Sachs, Paulson Henk. Why is the finance minister Henk Paulson US? If we see points 3 and 6, show that the debtor is able to pay the loan on which interest is today. Then points 4 shows that if the debtor is "helped", it will benefit the bank or creditor. Most current asset value (homes) have gone down and the value is lower than the debt. Banks and lenders will be a big loss if it receives collateral whose value has been below the value of its debt. Perhaps it reminds you of the monetary crisis in Indonesia, where the collateral value has fallen below the value of the debt of the conglomerate when done menyerahan / foreclosure of collateral. Genesis in the US is now equal to the incidence of financial crisis in Indonesia. The role of the debtor in the US is currently held by the prospective owner of the house and in the future krismon Indonesia was once the debtor conglomerate. End of the subprime crisis in the US is unpredictable, which is similar to the end of the financial crisis in Indonesia. Many banks are broken, need assistance and currency liquiditi crashing. The first impact: the bank collapsed, the symptoms are already visible. The number of banks closed in 2007 began to appear, after two years of net (Table-1).
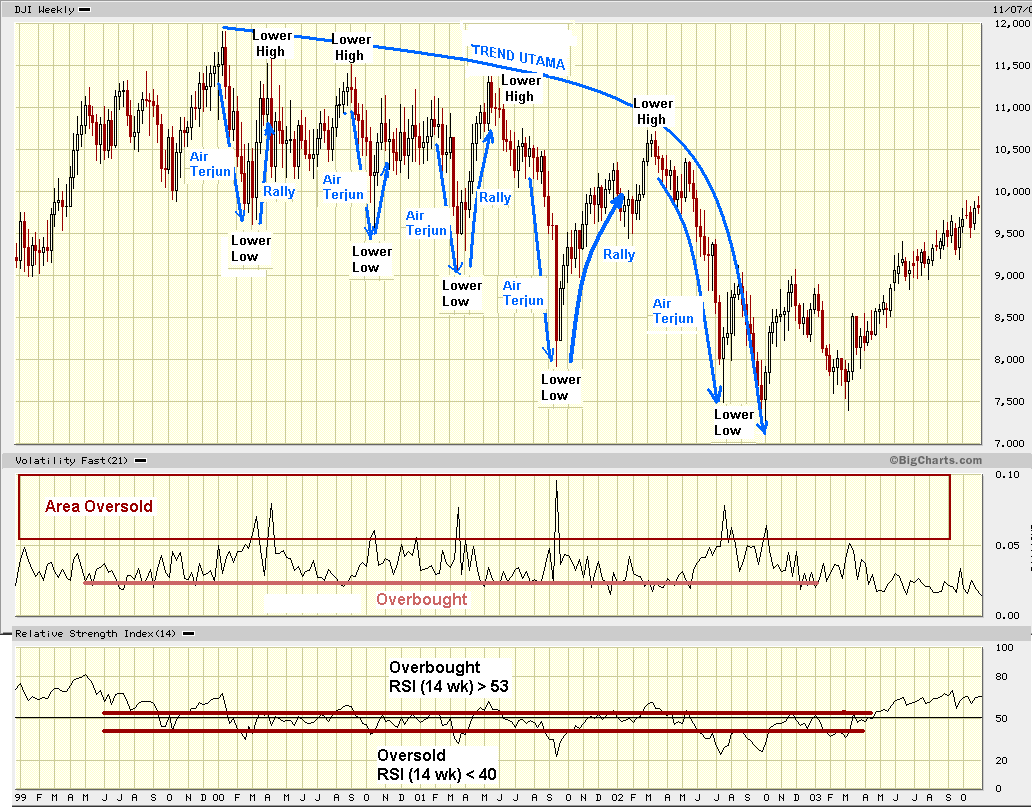
Table-1 (Source from FDIC) (click to enlarge) The above table shows that the banks closed in the US since 2000. In the know in 2002, on the eve of the recession the number of banks peaked cap. And since 2005, no bank is closed until 2006. And in 2007 began to appear again. Is this a sign of the onset of the initial round of the wave of banks in the US were closed again. Currently only subprime mortgages, following failure to pay / renege on car loans are almost certain real-estate developer who went bankrupt also will renege on the debt. Not wrong if we assume that the above list will grow rapidly future ahead 2-4. Fuss if no bank is bankrupt, closed, then people will withdraw their money from the bank. By investors, banks will be required to buy back the bond mortgage loans (mortgage bond) at nominal prices. Liquidity crisis, deflation, who knows what else. Domino effect in the economic sector. Paulson and Bush tried to help the banks to prevent pengemplangan mortgage loans, not to help mortgage borrowers. If the value of the collateral falls below the value of its debt, for better debtor declared bankruptcy, handing collateral, out of home and living by renting a house. Let the creditors to swallow losses with eyes bulging. Creditors are also guilty of giving loans to people who can not afford to pay. But this right is not desired Paulson. And in this case Paulson that before so US finance minister on July 10, 2006, headed Goldman Sachs also culpable. Under Paulson, Goldman Sachs makes inserting subprime debt into packages of securities and diligent sell everywhere. (Despite its name, securities, if taxable subprime cases, become worthless). I'm not willing to bet that Paulson can be taken to court. Where there could penggede to court. But who knows? TO (NOT) policies STATE - INDONESIA In Indonesia, the government wants to do (in) wisdom to raise premium prices. Lie-fib occurs. As usual, the issue of class differences proffered, and wrong again. It's my spiel sitirkan Wapes of AFP entitled: Restrictions to save subsidy of Rp 6 trillion ( http://www.suarakarya-online.com/news.html?id=187968 ) : "We do not want to hurt the little people, not harm the motorcycle, does not harm the motorcycle, not harming a taxi, do not harm public transportation, and so forth," said the vice president. " Yes, if you ride mercy, volvo, already pay," he said. That premium hike is reasonable to compel the owners of luxury cars use fuel that is not subsidized. Comments sane: "Mr. Vice President, people who have luxury cars, BMW, Mercedes, Volvo, money is not an obstacle anymore.They already do not wear anymore premium, even those many who do not believe in Pertamax, Pertamax Plus or Fastron. They have more confidence in Shell or Petronas, especially oil Syntium 5000 ". Not a promotion. Please try to use fuel oil Syntium 5000 with super shell, you will know the difference. Back to the matter of removal of subsidies on gasoline, so ....., which will be affected is the group known as the group is not harmed, motorcycle, bike and public transport , Then, this impact will spread to the price of basic commodities and other materials due to rising transportation costs, the next domino effect hitting other sectors. The crisis of fuel in Indonesia will continue due to (not) policy of oil and gas investment in Indonesia is still as it is now. Many regions of production sharing contracts offered in recent years, and are rarely major players such as ExxonMobil, ConocoPhillips, BP, participated. Most small players and speculators who do not have money to meet its exploration commitments.The purpose of these speculators only to master the concession area (work area), and then sold again. Black-listed for the PPP (Production Sharing Contractors). Besarpun many players make blunders. Belanak field is planned to produce 85,000 bbl / day, only capable of 15,000 bbl / day, while investment reached $ 1 billion and swollen due to problems of mercury which is not alleged or is hidden. BP's Tangguh LNG project, which is too long deferred, eventually the road as well. Probably not very profitable because the price of LNG to China is low and a lot of competition, especially from Qatar. Structural fiscal in Indonesian oil and gas sector is not attractive, for those who understand and want to run the oil and gas business for the long term.For those who do not understand, such as the small players who do not have enough skilled staff, they get stuck in to the business of exploration and exploitation (E & P) of oil and gas. The main issue facing is the system of taxation rules and overlapping between the Ministry of Energy and Natural Resources (EMR) with the Ministry of Finance (Tax). For example, according to the Oil and Gas Production Sharing Contract, upstream oil and gas industry are exempt from all taxes except income tax, tax on interest, royalties and dividends. Meanwhile, import duties, VAT, and others were released. In practice, how? BP Migas who signed a contract with KPS, acting as government representatives. BP Migas chairman is directly responsible to the president. For those who like compare-madankan, it can be said that the position of BP Migas aligned with the Department, either Dept. Finance (with a range of customs / tax) or Dept.EMR. In practice, the head of BP Migas overshadowed by the minister, the result when the government breached contractual agreements PPP (cq. Directorate General of Taxes) BP Migas did not dare do anything. For example regarding import duties, the PPP must pay. Back when his day-BPKKA prihal Pertamina imported goods is set in the master-list Pertamina and are not subject to customs duties. Because Pertamina has become a limited company, the duty-free import rule seems lost. KPS also have to pay import duties of all the tools (rig for example) that will be hired and brought in from abroad. Cost duty is larger than than the rent itself. What is not crazy? Indeed, if the stuff in-reexport again, the money would go back (sometimes in the form of money but it can be credited to the tax in the future) but the point KPS should provide additional capital to cover things that were not taken into account. For companies that are still in the exploratory phase, where there is no revenue, cash flow is still red, it is extremely burdensome. There's more to credit increasingly difficult to raise funds. That is why, according to estimates sane person that SBY targets for oil production 1.0350 million bbl / day would have been impossible. Next time we will discuss about the profanity legislation in the oil and gas sector. In essence, already many laws, overlapping each other, collide and must be subtracted.In other words, no longer need the laws and institutions of the lawmakers. Any news on Media Indonesia on Monday, December 10, 2007 and entitled "International Anti-Corruption Day, Day of Most Concern". This article in the anti-corruption framework (http://www.mediaindonesia.com/ ), and the degree of corruption in Indonesia. Ter position held by the top ranks of the police with a score of 4.2. Position II is the Parliament (DPR) and the judiciary with a score of 4.1. And III to the position held by a political party with a score of 4.0. On site EOWI (People Sane Economy and Investment) since its foundation we have already mentioned: There is a small swindler, imposter, politicians and Cut Zahara Fonna. Do not be surprised if we encourage you suppose theft, kerampokan, do not have to go to the police, because you will spend even more. Also, do not cooperate with the police on security issues, the better the security. And select an empty chair when the polls. Do you want to choose people from group III corrupt number to increase to corrupt number II and make you poorer or impoverished? Home care benefit of a legislator is Rp 13 million / month (Media Indonesia: Starting in January, the House of Representatives 'washed' allowances house Rp13 million,http://www.mediaindonesia.com/ ). That is more than 13 times the minimum wage in Jakarta. I think the trend of the future, no more corruption in the House, but enriching themselves legally. Same way with this and that adding benefits, and all legal backed by legislation. LHA those who make the laws anyway. Do not bother corruption, is not it? Therefore, I ask for popularizing the Movement Select Empty seats for the 2009 election you come to the polls and coblos lot of candidates so that your vote does not apply. That is the meaning Select Empty Chairs. You participate to choose an empty seat. REVIEW MARKET SHARE (CALM BEFORE THE STORM) Within 2 weeks the market rebounded (Chart 1). RSI has reached the 60s. The VIX index also declined (Chart 2), the market is quiet. Although there is strong resistance at 13700 for the Dow Industrial, the possibility of this level can be broken for the next Level 13.800 and 13.950. Santa Clause rally there may be, maybe not. The Fed will reduce interest rates on December 11, 2007. The market will probably greet him emotionally. If these emotional things happen, then the drug the Fed can work up to 2 months, and the market will be bullish or sideways for 2 months, in December 2007 until February 2008, as happened a few months ago. In terms of annual habit, it seems this time span is quite plausible. So for those who want to do the shorting, should pay attention to this.


Chart 2 (click to enlarge) Yen Carry Traders seem to still have room for banging Yen index to the lower limit of the corridor bullish Yen index (Chart 3). Approximately 2 weeks there is still time to bullish.

Chart 3 (click to enlarge) For me, during this quiet period, I will begin to collect and maintain a short position (for a while) a long position. In the long position, should not be too long to hold financials, properties and emerging markets. I myself have disposed of all long positions in the financial sector. Passable with the option, can profit 30% -50% in just 2 weeks. While a long position on gold and silver sector, I dare to hold much longer. Gammon Lake (GRS), Metalline (MMG), Aluminum China (ACH) and Seabridge (SA), I still hold. I will add the position of precious metals and mining sectors. Targetting DEAD CAT BOUNCE There are three things that make the stock go up:
1. Economy
2. The performance of the company
3. Emotion market for stocks below, such as the transport sector in the US - IYT, with the economy slowing, transportation services will be reduced preoccupations deliver the goods.Revenue will decrease, so does the profit. So fundamentally bearish, bullish emotional. So just wait for when the influence of doping Ben Bernanke exhausted. That's when the party starts again. To take a short position for the stocks / ETFs below, I will wait after the announcement of the Fed rate cut. I do not like surprises. If the market reaction is overdone and the market rallied strongly, then all the analysis below is not valid and should be reviewed again. IYT today, on Monday, December 10, 2007, closed at 88. Resistance at level 90 which is relatively strong. During the two weeks is up 12%. RSI is still overbought. But it should be remembered that this is not a bull market currently. So IYT could reverse direction, so I will start collecting a short position at level 88-91, then waiting to see if IYT will continue to rise. Suppose there are signs of exhaustion IYT then a short position will be added. I doubt that IYT rate can reach 90. In Rebounce October alone, IYT could not follow in the footsteps Industrial Dow or the S & P500. So it's hard to say that IYT rate can reach 90. My favorite is the June $ 90 put. What I do not like work directly in IYT currently MACD indicator is still showing bullish direction and has not been confirmed to enter in a short position. Therefore, you should wait after the announcement of the Fed interest rate and observed again. Chart 4 (click to enlarge) Next is a home improvement retailer Lowe's shares (LOW). Since last October I was short with the option $ 27.5 January 09 put. But I loose when the market was oversold last 2 weeks. I thought it was time to go back to the short position is similar, $ January 25 09 put. Date December 11, 07 and then, this option closed at $ 3.70. I choose Jan '09 as expiry datenya since the expiry dat July 08 and Jan 09 is not much difference. Same case with IYT, which I do not like to work directly in the LOW presently is the MACD indicators still show the direction of bullish and has not been confirmed for entry at position short. Therefore, you should wait after the announcement of the Fed interest rate and observed again. Chart 5 (click to enlarge) The same applies to the Consumer Discretionary ETF XLY (Chart 6). $ 36 January 09 put option on the day Monday, December 11 and closed at $ 3.50. As IYT and LOW, which I do not like work directly in XLY today is MACD indicators still show the direction of bullish and has not been confirmed to enter in a short position. Therefore, you should wait after the announcement of the Fed interest rate and observed again.


chart 6
GOLD AND SILVER SECTOR
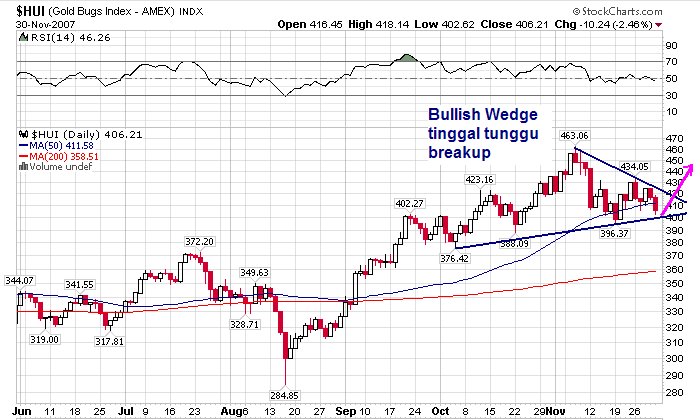
Sector gold stocks Gold Bugs (Chart 7) appears're taking a breather for the next rally (if any). At least not for a long position I dare a little linger for the sector. After over 1.5 years is the consolidation phase, we can expect that this sector will experience a period of comparable length bullish. In a previous article I mentioned a few stocks such as Gammon Lake (GRS), Seabridge (SA) and Metalline (MMG). These shares have experienced a correction in. This means that the stock transfer from the hands of investors who faint of heart to the heart of a lion quite a lot. To take stock of the hands of investors again take the lion takes courage to make a bid, so the potential is also expected to rebound quite promising. Technically, these stocks have upside potential: GFI, KCG, EXK, Azk. I'm not too concerned about the fundamentals, because the rise in gold of $ 650 / oz to $ 800 / oz for quite a while not to talk about the fundamentals. Chart 7 (click to enlarge) DOLLAR MAU BEHIND THE DIRECTION?Economist edition of December 1, 2007 and then, bercover front of nyungsepnya dollar (see Figure 1). No one called Cover Page Reversal Indicator. This means that if an issue, in this case the fall in the dollar, already becoming the topic of the magazine and into the cover of a magazine then it is a sign of impending change of direction. In this case the dollar will strengthen. The reason that the journalist was the last one to know the news. I doubt that the US dollar will strengthen. Fundamentally does not support. That is until now not many other central banks that participate aggressively lower interest rates. Iran even has officially refused to accept payment in US dollars. Technically possibly can. But the Chart-8 does not show something special to rebound significantly to the US dollar. If the US dollar index can break 80 then Rebounce could last into bullish phase. If the US dollar continues to weaken and penetrate to the bottom level 70, then it is likely nyungsep keeps getting bigger.


Figure 1 (click to enlarge)

Chart 8 (click to enlarge)
REFLECTION
Devotional time is short. Indonesia has conducted the first general elections were the most democratic. It is seated Indonesia as the third largest country in the world, after India, US.What are the implications? The word of social science experts-political: " Powers growing niche to corrupt ." The consequences of logical: " More people with power, lead to more corruption "If power tends to corrupt, so many people who have power mean more corruption. That picture of democracy, the Parliament, the President and the current government have been democratically from the group institutions that corrupt number III (political parties), the election was organized KPU (General Election Commission) whose chairperson is now curled up in jail for corruption, do you expect the result is not an institution that corrupt? for the upcoming 2009 elections, do you still want to choose to give power to the people of the group / the most corrupt institutions to III - political parties, so that they become the most corrupt II - parliament? I decided to choose an empty seat. Do you also? Up here for this week. Take care of your health savings and your investments carefully.